Building a Personal Finance Tracker with Python Pandas
Introduction
Managing personal finances can feel overwhelming when juggling multiple bank accounts, credit cards, and digital payment services. Fortunately, Python’s pandas library provides a convenient and powerful way to automate financial tracking and analysis. In this tutorial, we’ll walk through how to build a personal finance tracker using CSV statement files, categorize expenses, and generate dynamic summaries with insightful visualization-ready data. By the end, you’ll have a foundation you can adapt into a robust personal budgeting tool.
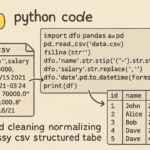
1. Loading and Cleaning CSV Bank Statements
Most banks provide transaction exports as CSV files. Let’s start by loading and cleaning this data. Suppose your CSV file contains columns like Date, Description, and Amount.
import pandas as pd

# Load CSV bank statement
df = pd.read_csv('bank_statement.csv')

# Inspect data
print(df.head())

# Standardize column names
df.columns = df.columns.str.strip().str.lower()

# Convert date column to datetime
df['date'] = pd.to_datetime(df['date'])

# Handle missing or invalid values
df = df.dropna(subset=['amount'])
Why it works: By converting dates early and normalizing column names, we ensure operations like filtering by date or grouping by category work consistently. Dropping invalid data prevents calculation errors during aggregation later on.
2. Categorizing Expenses Automatically
One of the biggest time savers in personal finance tracking is automatic categorization. Let’s use string matching logic to map transaction descriptions to custom categories.
# Define custom rules for categories
categories = {
    'Groceries': ['supermarket', 'grocery', 'market'],
    'Utilities': ['electric', 'water', 'internet', 'utility'],
    'Dining': ['cafe', 'restaurant', 'food'],
    'Travel': ['uber', 'lyft', 'airlines'],
    'Entertainment': ['netflix', 'spotify', 'movie']
}

# Function to categorize each transaction
def categorize(description):
    description = description.lower()
    for category, keywords in categories.items():
        if any(keyword in description for keyword in keywords):
            return category
    return 'Other'

# Apply category function
df['category'] = df['description'].apply(categorize)

print(df[['description', 'category']].head())
Why it works: Pandas’ apply function lets you run efficient row-wise transformations using Python functions. While string matching is simplistic, it’s sufficient for most personal finance situations and can be extended using regular expressions or machine learning models later.
3. Summarizing Monthly Expenses
Now that transactions are categorized, you can explore trends over time. Let’s group transactions by month and category to calculate total spending.
# Extract month and year
df['month'] = df['date'].dt.to_period('M')

# Group by month and category
monthly_summary = df.groupby(['month', 'category'])['amount'].sum().reset_index()

print(monthly_summary.head())
Why it works: Using to_period('M') simplifies time-based grouping by treating each month as a distinct period. Aggregations like sum() easily summarize financial data across any timeframe. These results are ready to visualize, for example, in a bar chart showing monthly spending trends.
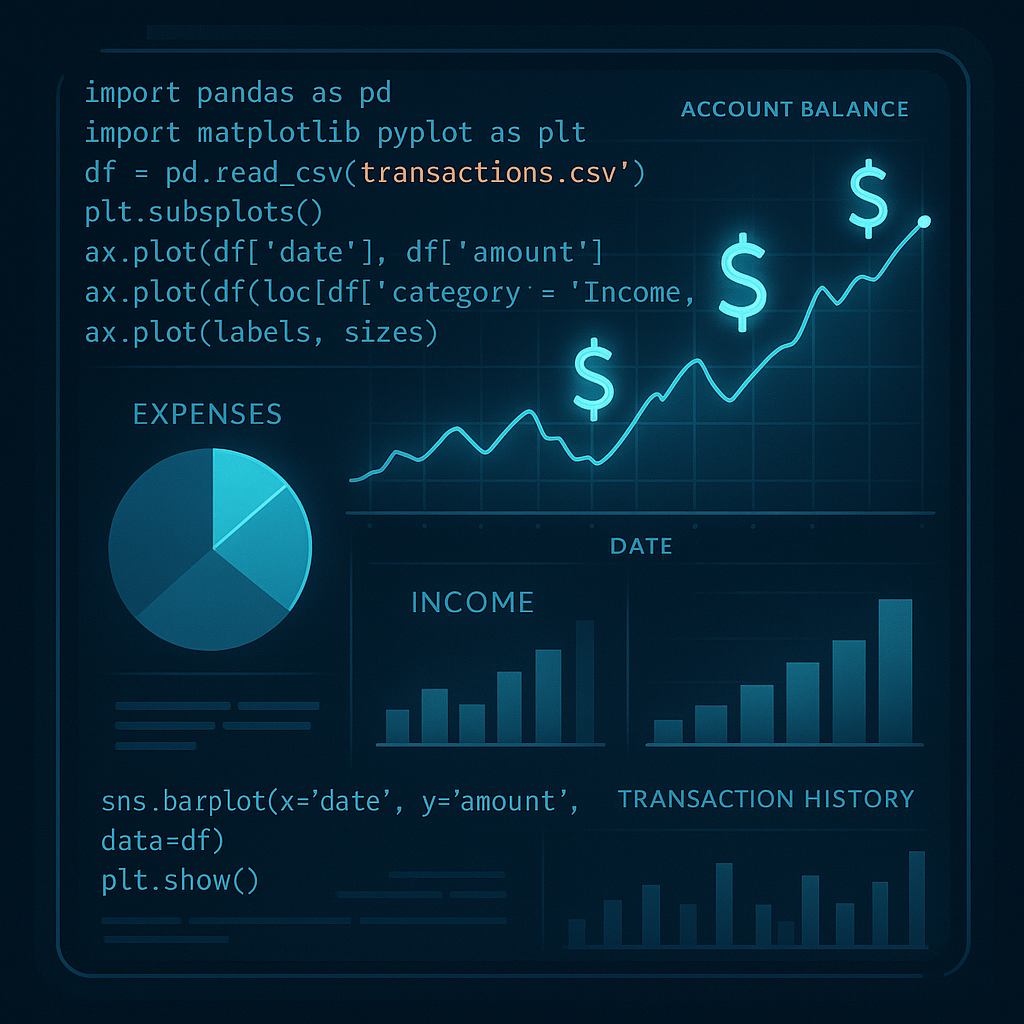
4. Generating Insights and Visual Summaries
Let’s enhance the analysis by identifying top spending categories and plotting them using matplotlib. This gives a visual sense of where most of your money goes.
import matplotlib.pyplot as plt

total_by_category = df.groupby('category')['amount'].sum().sort_values(ascending=False)

# Display top 5 categories
print(total_by_category.head())

# Simple bar chart
plt.figure(figsize=(8, 4))
total_by_category.plot(kind='bar', color='skyblue')
plt.title('Total Spending by Category')
plt.xlabel('Category')
plt.ylabel('Amount Spent ($)')
plt.tight_layout()
plt.show()
Why it works: By sorting totals, we quickly identify key spending areas. Visual summaries help you make informed budgeting decisions, giving an overview of financial health at a glance.
5. Automating and Optimizing the Workflow
You can automate this entire process to run periodically or on-demand. Using Python’s glob module and a few optimizations, you can process multiple CSVs efficiently.
import glob

# Read all CSV files from directory
all_files = glob.glob('data/bank_*csv')

# Concatenate all data into one DataFrame
dfs = [pd.read_csv(file) for file in all_files]
combined = pd.concat(dfs, ignore_index=True)

# Apply previous cleaning and categorization logic
combined['date'] = pd.to_datetime(combined['date'])
combined['category'] = combined['description'].apply(categorize)

# Save summary to CSV
summary = combined.groupby(['category'])['amount'].sum().reset_index()
summary.to_csv('expense_summary.csv', index=False)
print('Expense summary saved successfully!')
Performance tip: For very large datasets, consider switching to dask or chunked reading with pd.read_csv(..., chunksize=50000) to manage memory efficiently. Automating the above script with cron or Windows Task Scheduler allows hands-free monthly updates of your finance dashboard.
Conclusion
With just a few lines of Python and pandas, you can transform raw bank data into a meaningful financial report. You learned how to clean and organize data, categorize expenses, and visualize spending patterns. From here, you could add features like detecting recurring payments or exporting results into formatted Excel reports. Your code can evolve alongside your financial goals — efficient, automated, and data-driven.
Useful links: